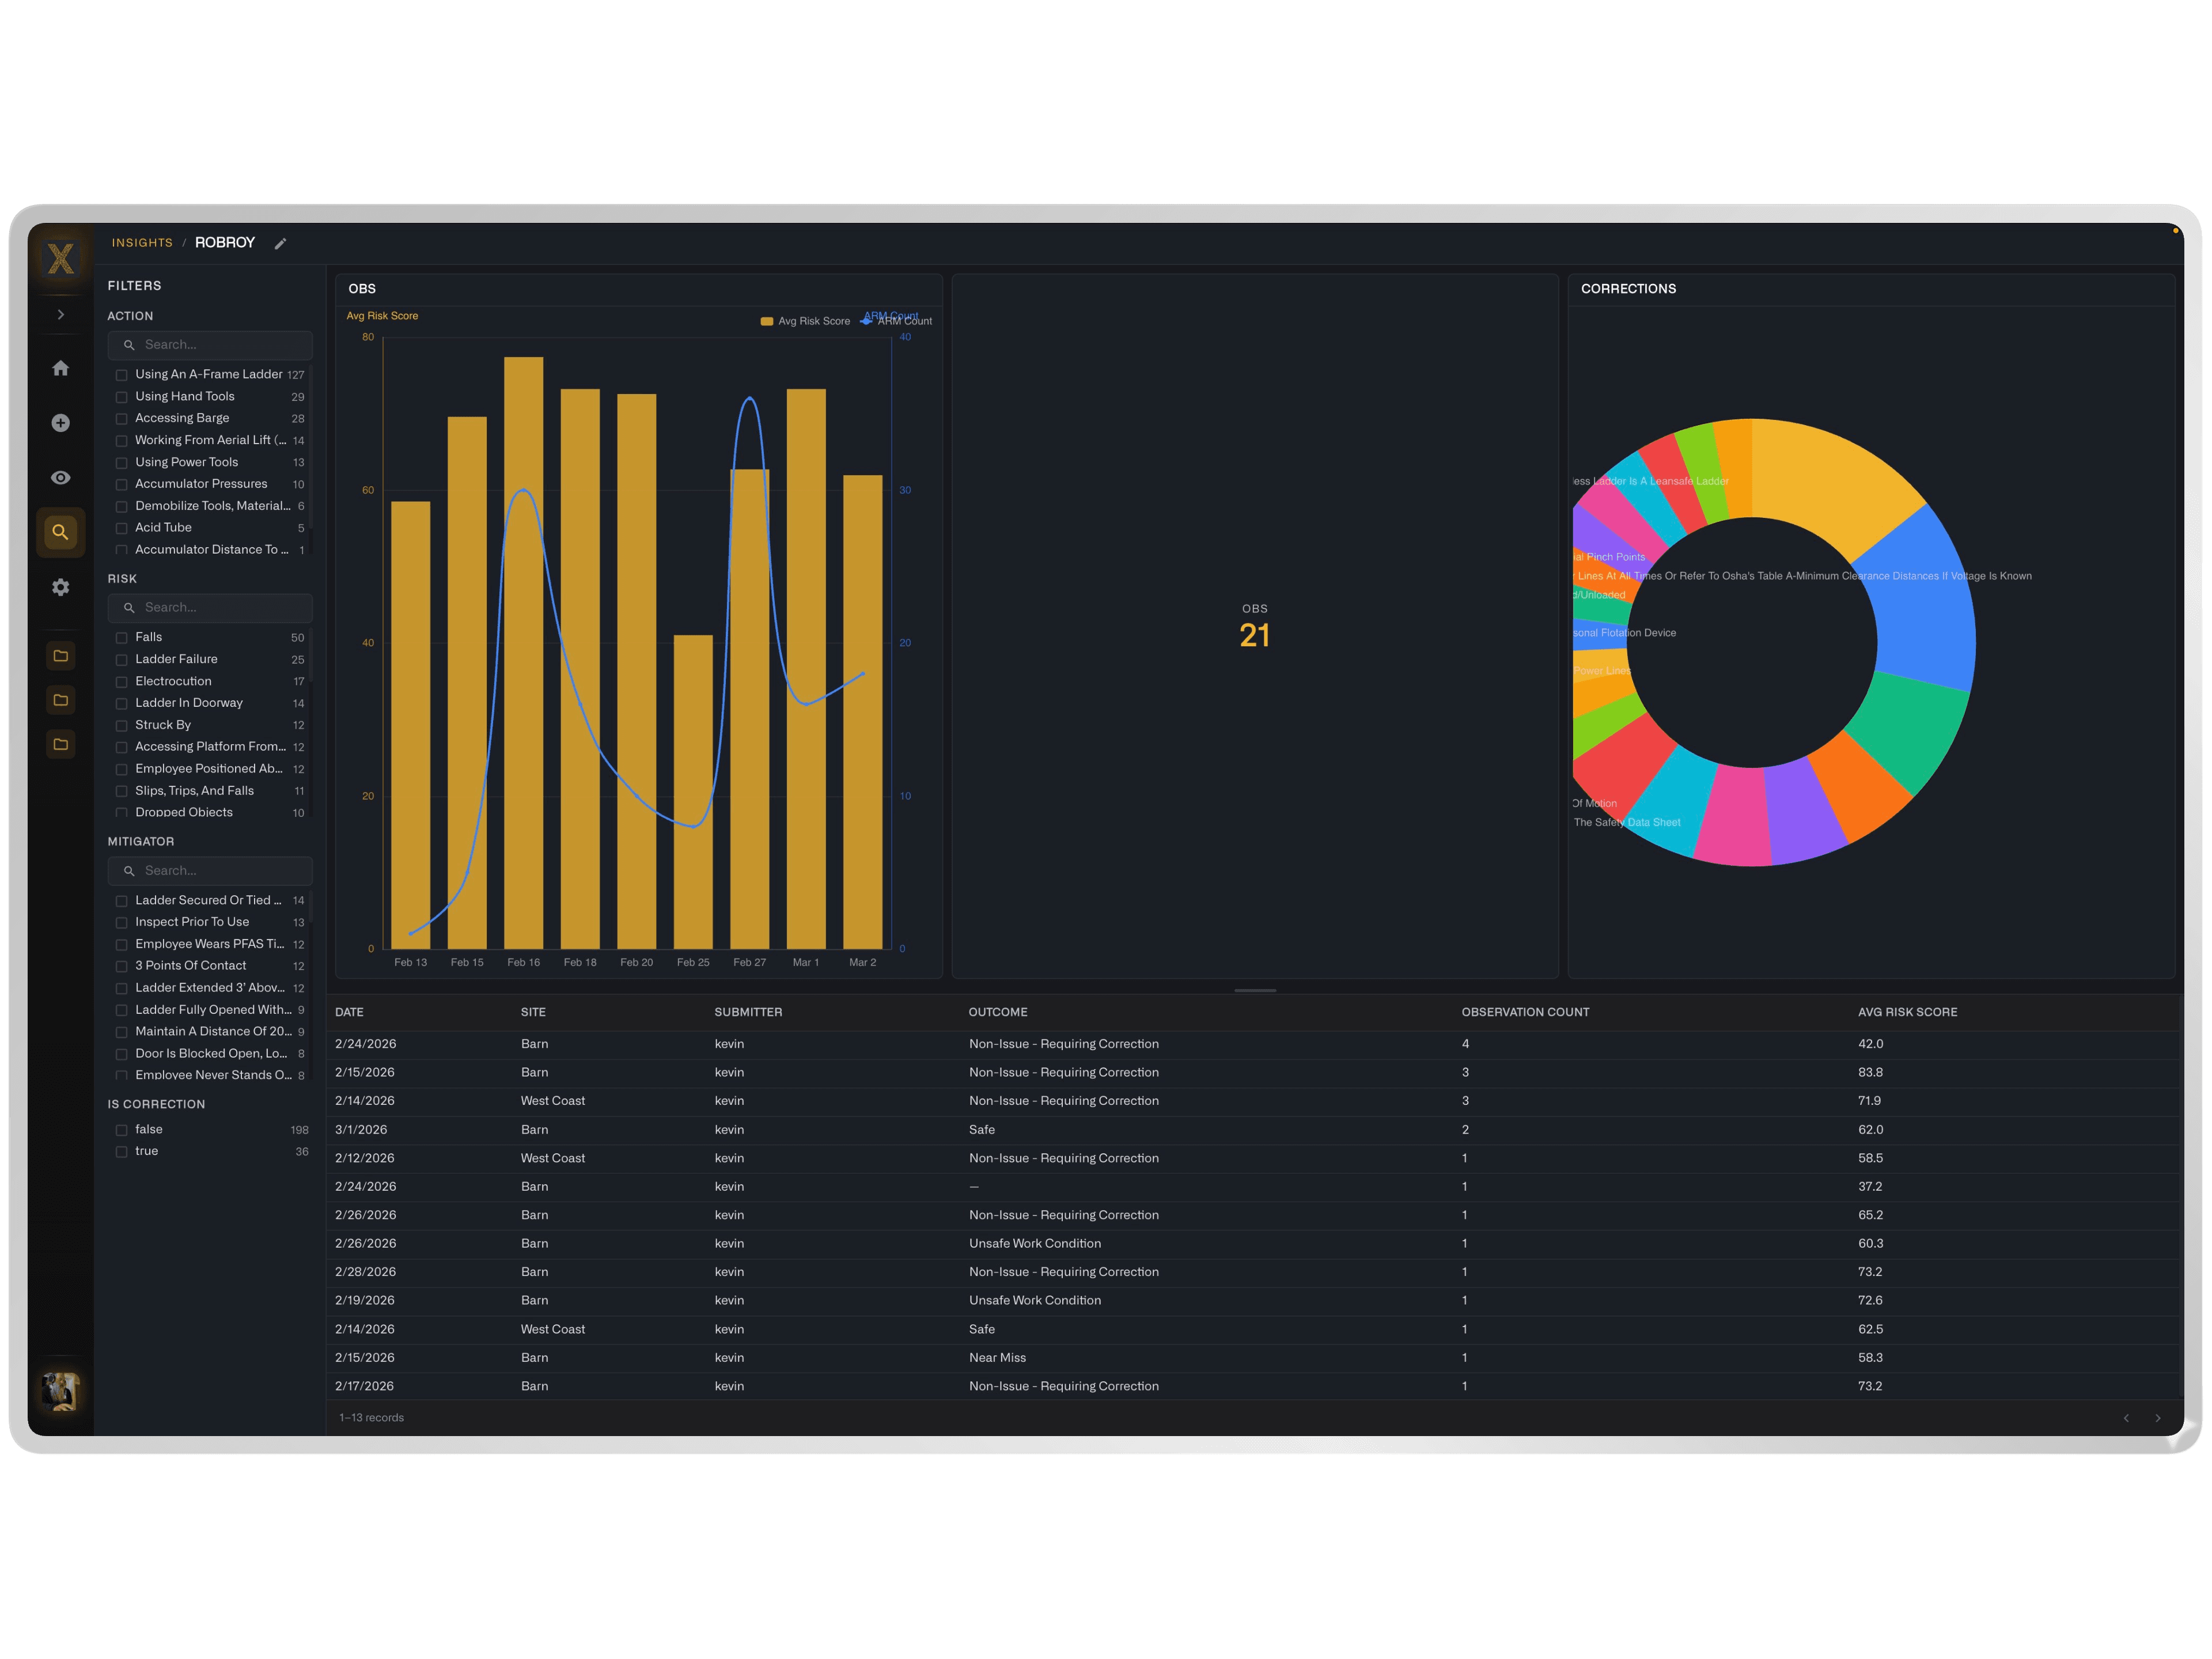
Enterprise safety leaders and risk managers need visibility that goes beyond individual project reports. NIXN Risk Dashboards aggregate data from daily logs, incident reports, JHAs, audits, equipment inspections, and contractor pre-qualification across the entire organization — presenting trends, anomalies, and leading indicators in real-time executive dashboards.
Each dashboard is configurable by role — corporate safety directors see portfolio-wide trends and benchmark comparisons, project managers see site-level leading indicators, and field supervisors see crew-specific safety performance. Data refreshes continuously as field teams submit observations, complete inspections, and document conditions through NIXN's mobile workflows.
NIXN Risk Dashboards go beyond lagging indicator reporting by correlating leading indicators with outcome data. When observation frequency drops in a specific project area while hazard severity scores increase, the dashboard surfaces this divergence as an early warning — enabling intervention before incidents occur rather than analysis after the fact.